


Census Tract 312, Henry County, Illinois
About
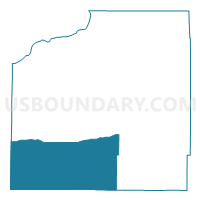
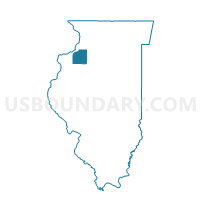
Outline

Summary
| Unique Area Identifier | 455257 |
| Name | Census Tract 312 |
| County | Henry County |
| State | Illinois |
| Area (square miles) | 147.44 |
| Land Area (square miles) | 147.38 |
| Water Area (square miles) | 0.06 |
| % of Land Area | 99.96 |
| % of Water Area | 0.04 |
| Latitude of the Internal Point | 41.21328740 |
| Longtitude of the Internal Point | -90.25642110 |
| Total Population | 3,014 |
| Total Housing Units | 1,357 |
| Total Households | 1,249 |
| Median Age | 45.1 |
Maps

Graphs
Select a template below for downloading or customizing gragh for Census Tract 312, Henry County, Illinois


Neighbors
Neighoring Census Tract (by Name) Neighboring Census Tract on the Map
- Census Tract 1, Knox County, IL
- Census Tract 302.01, Henry County, IL
- Census Tract 302.02, Henry County, IL
- Census Tract 305, Henry County, IL
- Census Tract 311, Henry County, IL
- Census Tract 401, Mercer County, IL
- Census Tract 404, Mercer County, IL
Top 10 Neighboring County Subdivision (by Population) Neighboring County Subdivision on the Map
- Galva township, Henry County, IL (2,837)
- Cambridge township, Henry County, IL (2,525)
- Richland Grove township, Mercer County, IL (2,300)
- Oxford township, Henry County, IL (1,213)
- Rivoli township, Mercer County, IL (1,142)
- Andover township, Henry County, IL (954)
- Ontario township, Knox County, IL (943)
- Clover township, Henry County, IL (938)
- Walnut Grove township, Knox County, IL (770)
- Lynn township, Henry County, IL (745)
Top 10 Neighboring Place (by Population) Neighboring Place on the Map
- Woodhull village, IL (811)
- Windsor village, IL (748)
- Alpha village, IL (671)
- Bishop Hill village, IL (128)
Top 10 Neighboring Unified School District (by Population) Neighboring Unified School District on the Map
- Sherrard Community Unit School District 200, IL (9,307)
- United Community School District 304, IL (6,125)
- Orion Community Unit School District 223, IL (5,995)
- ROWVA Community Unit School District 208, IL (3,879)
- Galva Community Unit School District 224, IL (3,570)
- Cambridge Community Unit School District 227, IL (3,006)
- Alwood Community Unit School District 225, IL (2,398)
Top 10 Neighboring State Legislative District Lower Chamber (by Population) Neighboring State Legislative District Lower Chamber on the Map
- State House District 71, IL (104,867)
- State House District 72, IL (101,862)
- State House District 74, IL (100,949)
- State House District 94, IL (100,005)
Top 10 Neighboring State Legislative District Upper Chamber (by Population) Neighboring State Legislative District Upper Chamber on the Map
- State Senate District 37, IL (218,476)
- State Senate District 36, IL (206,729)
- State Senate District 47, IL (203,948)
Top 10 Neighboring 111th Congressional District (by Population) Neighboring 111th Congressional District on the Map
- Congressional District 14, IL (840,956)
- Congressional District 18, IL (665,723)
- Congressional District 17, IL (634,792)
Top 10 Neighboring 5-Digit ZIP Code Tabulation Area (by Population) Neighboring 5-Digit ZIP Code Tabulation Area on the Map
- 61434, IL (3,312)
- 61238, IL (3,247)
- 61465, IL (1,213)
- 61262, IL (1,188)
- 61490, IL (1,091)
- 61413, IL (1,075)
- 61467, IL (1,048)
- 61414, IL (854)
- 61472, IL (648)
- 61419, IL (128)
Data
Demographic, Population, Households, and Housing Units
** Data sources from census 2010 **
Show Data on Map
Download Full List as CSV
Download Quick Sheet as CSV
| Subject | This Area | Henry County | Illinois | National |
|---|---|---|---|---|
| POPULATION | ||||
| Total Population Map | 3,014 | 50,486 | 12,830,632 | 308,745,538 |
| POPULATION, HISPANIC OR LATINO ORIGIN | ||||
| Not Hispanic or Latino Map | 2,967 | 48,084 | 10,803,054 | 258,267,944 |
| Hispanic or Latino Map | 47 | 2,402 | 2,027,578 | 50,477,594 |
| POPULATION, RACE | ||||
| White alone Map | 2,961 | 47,846 | 9,177,877 | 223,553,265 |
| Black or African American alone Map | 13 | 796 | 1,866,414 | 38,929,319 |
| American Indian and Alaska Native alone Map | 1 | 93 | 43,963 | 2,932,248 |
| Asian alone Map | 6 | 191 | 586,934 | 14,674,252 |
| Native Hawaiian and Other Pacific Islander alone Map | 0 | 14 | 4,050 | 540,013 |
| Some Other Race alone Map | 7 | 814 | 861,412 | 19,107,368 |
| Two or More Races Map | 26 | 732 | 289,982 | 9,009,073 |
| POPULATION, SEX | ||||
| Male Map | 1,514 | 25,112 | 6,292,276 | 151,781,326 |
| Female Map | 1,500 | 25,374 | 6,538,356 | 156,964,212 |
| POPULATION, AGE (18 YEARS) | ||||
| 18 years and over Map | 2,362 | 38,391 | 9,701,453 | 234,564,071 |
| Under 18 years | 652 | 12,095 | 3,129,179 | 74,181,467 |
| POPULATION, AGE | ||||
| Under 5 years | 170 | 3,006 | 835,577 | 20,201,362 |
| 5 to 9 years | 168 | 3,316 | 859,405 | 20,348,657 |
| 10 to 14 years | 177 | 3,430 | 879,448 | 20,677,194 |
| 15 to 17 years | 137 | 2,343 | 554,749 | 12,954,254 |
| 18 and 19 years | 74 | 1,252 | 367,343 | 9,086,089 |
| 20 years | 26 | 521 | 179,613 | 4,519,129 |
| 21 years | 26 | 452 | 172,795 | 4,354,294 |
| 22 to 24 years | 71 | 1,392 | 526,556 | 12,712,576 |
| 25 to 29 years | 136 | 2,631 | 910,273 | 21,101,849 |
| 30 to 34 years | 172 | 2,872 | 865,684 | 19,962,099 |
| 35 to 39 years | 168 | 2,958 | 855,790 | 20,179,642 |
| 40 to 44 years | 179 | 3,091 | 870,100 | 20,890,964 |
| 45 to 49 years | 244 | 3,738 | 940,094 | 22,708,591 |
| 50 to 54 years | 296 | 3,976 | 930,785 | 22,298,125 |
| 55 to 59 years | 223 | 3,669 | 807,778 | 19,664,805 |
| 60 and 61 years | 77 | 1,344 | 284,180 | 7,113,727 |
| 62 to 64 years | 127 | 1,871 | 381,249 | 9,704,197 |
| 65 and 66 years | 66 | 1,070 | 205,270 | 5,319,902 |
| 67 to 69 years | 92 | 1,456 | 279,790 | 7,115,361 |
| 70 to 74 years | 153 | 1,928 | 364,475 | 9,278,166 |
| 75 to 79 years | 101 | 1,659 | 289,385 | 7,317,795 |
| 80 to 84 years | 77 | 1,244 | 235,381 | 5,743,327 |
| 85 years and over | 54 | 1,267 | 234,912 | 5,493,433 |
| MEDIAN AGE BY SEX | ||||
| Both sexes Map | 45.10 | 41.80 | 36.60 | 37.20 |
| Male Map | 44.60 | 40.00 | 35.20 | 35.80 |
| Female Map | 45.60 | 43.50 | 37.90 | 38.50 |
| HOUSEHOLDS | ||||
| Total Households Map | 1,249 | 20,373 | 4,836,972 | 116,716,292 |
| HOUSEHOLDS, HOUSEHOLD TYPE | ||||
| Family households: Map | 886 | 14,149 | 3,182,984 | 77,538,296 |
| Husband-wife family Map | 756 | 11,385 | 2,332,995 | 56,510,377 |
| Other family: Map | 130 | 2,764 | 849,989 | 21,027,919 |
| Male householder, no wife present Map | 47 | 831 | 227,684 | 5,777,570 |
| Female householder, no husband present Map | 83 | 1,933 | 622,305 | 15,250,349 |
| Nonfamily households: Map | 363 | 6,224 | 1,653,988 | 39,177,996 |
| Householder living alone Map | 300 | 5,311 | 1,346,312 | 31,204,909 |
| Householder not living alone Map | 63 | 913 | 307,676 | 7,973,087 |
| HOUSEHOLDS, HISPANIC OR LATINO ORIGIN OF HOUSEHOLDER | ||||
| Not Hispanic or Latino householder: Map | 1,238 | 19,775 | 4,329,737 | 103,254,926 |
| Hispanic or Latino householder: Map | 11 | 598 | 507,235 | 13,461,366 |
| HOUSEHOLDS, RACE OF HOUSEHOLDER | ||||
| Householder who is White alone | 1,236 | 19,685 | 3,680,912 | 89,754,352 |
| Householder who is Black or African American alone | 5 | 240 | 668,152 | 14,129,983 |
| Householder who is American Indian and Alaska Native alone | 0 | 36 | 13,449 | 939,707 |
| Householder who is Asian alone | 1 | 46 | 192,603 | 4,632,164 |
| Householder who is Native Hawaiian and Other Pacific Islander alone | 0 | 4 | 1,278 | 143,932 |
| Householder who is Some Other Race alone | 1 | 211 | 213,509 | 4,916,427 |
| Householder who is Two or More Races | 6 | 151 | 67,069 | 2,199,727 |
| HOUSEHOLDS, HOUSEHOLD TYPE BY HOUSEHOLD SIZE | ||||
| Family households: Map | 886 | 14,149 | 3,182,984 | 77,538,296 |
| 2-person household Map | 474 | 6,923 | 1,259,669 | 31,882,616 |
| 3-person household Map | 159 | 2,934 | 720,213 | 17,765,829 |
| 4-person household Map | 149 | 2,527 | 644,972 | 15,214,075 |
| 5-person household Map | 77 | 1,227 | 326,688 | 7,411,997 |
| 6-person household Map | 19 | 362 | 132,759 | 3,026,278 |
| 7-or-more-person household Map | 8 | 176 | 98,683 | 2,237,501 |
| Nonfamily households: Map | 363 | 6,224 | 1,653,988 | 39,177,996 |
| 1-person household Map | 300 | 5,311 | 1,346,312 | 31,204,909 |
| 2-person household Map | 58 | 773 | 250,239 | 6,360,012 |
| 3-person household Map | 3 | 82 | 36,254 | 992,156 |
| 4-person household Map | 1 | 43 | 14,759 | 411,171 |
| 5-person household Map | 1 | 14 | 3,959 | 126,634 |
| 6-person household Map | 0 | 0 | 1,433 | 48,421 |
| 7-or-more-person household Map | 0 | 1 | 1,032 | 34,693 |
| HOUSING UNITS | ||||
| Total Housing Units Map | 1,357 | 22,161 | 5,296,715 | 131,704,730 |
| HOUSING UNITS, OCCUPANCY STATUS | ||||
| Occupied Map | 1,249 | 20,373 | 4,836,972 | 116,716,292 |
| Vacant Map | 108 | 1,788 | 459,743 | 14,988,438 |
| HOUSING UNITS, OCCUPIED, TENURE | ||||
| Owned with a mortgage or a loan Map | 575 | 9,558 | 2,338,493 | 52,979,430 |
| Owned free and clear Map | 447 | 6,428 | 925,146 | 23,006,644 |
| Renter occupied Map | 227 | 4,387 | 1,573,333 | 40,730,218 |
| HOUSING UNITS, VACANT, VACANCY STATUS | ||||
| For rent Map | 8 | 478 | 158,882 | 4,137,567 |
| Rented, not occupied Map | 2 | 27 | 7,998 | 206,825 |
| For sale only Map | 17 | 317 | 82,739 | 1,896,796 |
| Sold, not occupied Map | 5 | 118 | 16,677 | 421,032 |
| For seasonal, recreational, or occasional use Map | 29 | 195 | 47,289 | 4,649,298 |
| For migrant workers Map | 0 | 2 | 315 | 24,161 |
| Other vacant Map | 47 | 651 | 145,843 | 3,652,759 |
| HOUSING UNITS, OCCUPIED, AVERAGE HOUSEHOLD SIZE BY TENURE | ||||
| Total: Map | 2.41 | 2.44 | 2.59 | 2.58 |
| Owner occupied Map | 2.42 | 2.50 | 2.69 | 2.65 |
| Renter occupied Map | 2.39 | 2.24 | 2.38 | 2.44 |
| HOUSING UNITS, OCCUPIED, TENURE BY RACE OF HOUSEHOLDER | ||||
| Owner occupied: Map | 1,022 | 15,986 | 3,263,639 | 75,986,074 |
| Householder who is White alone Map | 1,016 | 15,612 | 2,728,000 | 63,446,275 |
| Householder who is Black or African American alone Map | 1 | 102 | 272,489 | 6,261,464 |
| Householder who is American Indian and Alaska Native alone Map | 0 | 17 | 6,873 | 509,588 |
| Householder who is Asian alone Map | 1 | 28 | 118,649 | 2,688,861 |
| Householder who is Native Hawaiian and Other Pacific Islander alone Map | 0 | 3 | 644 | 61,911 |
| Householder who is Some Other Race alone Map | 1 | 137 | 103,641 | 1,975,817 |
| Householder who is Two or More Races Map | 3 | 87 | 33,343 | 1,042,158 |
| Renter occupied: Map | 227 | 4,387 | 1,573,333 | 40,730,218 |
| Householder who is White alone Map | 220 | 4,073 | 952,912 | 26,308,077 |
| Householder who is Black or African American alone Map | 4 | 138 | 395,663 | 7,868,519 |
| Householder who is American Indian and Alaska Native alone Map | 0 | 19 | 6,576 | 430,119 |
| Householder who is Asian alone Map | 0 | 18 | 73,954 | 1,943,303 |
| Householder who is Native Hawaiian and Other Pacific Islander alone Map | 0 | 1 | 634 | 82,021 |
| Householder who is Some Other Race alone Map | 0 | 74 | 109,868 | 2,940,610 |
| Householder who is Two or More Races Map | 3 | 64 | 33,726 | 1,157,569 |
| HOUSING UNITS, OCCUPIED, TENURE BY HISPANIC OR LATINO ORIGIN OF HOUSEHOLDER | ||||
| Owner occupied: Map | 1,022 | 15,986 | 3,263,639 | 75,986,074 |
| Not Hispanic or Latino householder Map | 1,015 | 15,576 | 2,996,581 | 69,617,625 |
| Hispanic or Latino householder Map | 7 | 410 | 267,058 | 6,368,449 |
| Renter occupied: Map | 227 | 4,387 | 1,573,333 | 40,730,218 |
| Not Hispanic or Latino householder Map | 223 | 4,199 | 1,333,156 | 33,637,301 |
| Hispanic or Latino householder Map | 4 | 188 | 240,177 | 7,092,917 |
| HOUSING UNITS, OCCUPIED, TENURE BY HOUSEHOLD SIZE | ||||
| Owner occupied: Map | 1,022 | 15,986 | 3,263,639 | 75,986,074 |
| 1-person household Map | 227 | 3,464 | 732,688 | 16,453,569 |
| 2-person household Map | 460 | 6,634 | 1,111,442 | 27,618,605 |
| 3-person household Map | 132 | 2,390 | 529,763 | 12,517,563 |
| 4-person household Map | 117 | 2,087 | 493,300 | 10,998,793 |
| 5-person household Map | 64 | 981 | 238,851 | 5,057,765 |
| 6-person household Map | 17 | 301 | 92,193 | 1,965,796 |
| 7-or-more-person household Map | 5 | 129 | 65,402 | 1,373,983 |
| Renter occupied: Map | 227 | 4,387 | 1,573,333 | 40,730,218 |
| 1-person household Map | 73 | 1,847 | 613,624 | 14,751,340 |
| 2-person household Map | 72 | 1,062 | 398,466 | 10,624,023 |
| 3-person household Map | 30 | 626 | 226,704 | 6,240,422 |
| 4-person household Map | 33 | 483 | 166,431 | 4,626,453 |
| 5-person household Map | 14 | 260 | 91,796 | 2,480,866 |
| 6-person household Map | 2 | 61 | 41,999 | 1,108,903 |
| 7-or-more-person household Map | 3 | 48 | 34,313 | 898,211 |
Loading...